Original research
Data & Press
Original research on home affordability across the US, Canada, and the UK — free to cite, link to, and use. Pick a country below for its flagship stat, chart, and the full data behind it.
Data researched & maintained by Robinjit Singh · Last verified June 2026
All countries · flagship comparison
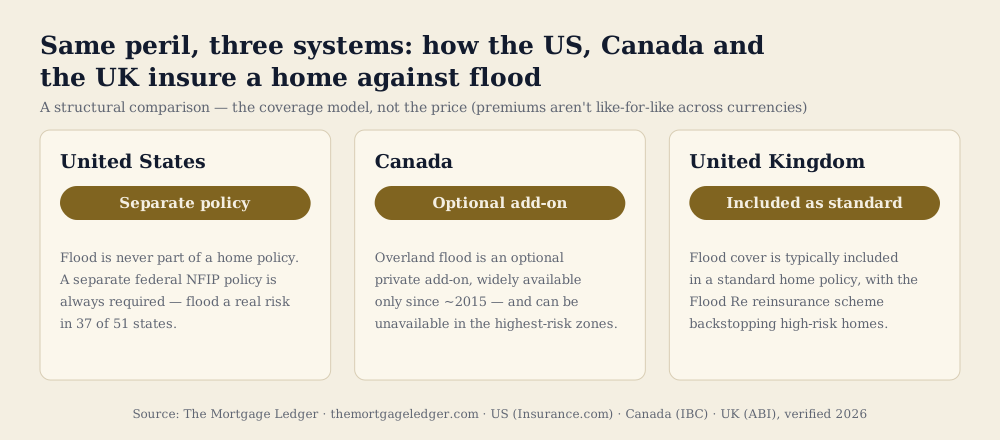
Separate · Optional · Included
Flood is the sharpest divide in how the three countries insure a home: in the US it is never part of a home policy — a separate federal NFIP policy is always required, even though flood is a real risk in 37 of 51 US states — while in Canada it is an optional private add-on (widely available only since 2015) and in the UK it is included as standard.
How to cite this: it compares the structure of flood coverage — the one thing that is genuinely like-for-like across the three countries. It is not a price comparison: premiums differ by currency and by what each policy covers (see the caveated cost comparison below). Full derivation and sources on Methodology.
Embed code
<img src="https://themortgageledger.com/press/flood-coverage-by-country.svg"
     alt="How the US, Canada and the UK insure a home against flood (structural comparison)"
     width="1000" />
<p>Source: <a href="https://themortgageledger.com/press#cross-country">The Mortgage Ledger</a></p>
More cross-country context (read the caveats)
Home insurance costs far more in the US — but read this directionally
On the figures we hold: the US averages $2,543 on a fixed $300,000-dwelling benchmark, versus roughly $1,253 CAD (average policy) in Canada and £258 in the UK. Caveats: the US figure is a fixed benchmark while the Canada/UK figures are unpriced average policies (coverage is not matched), and putting all three in one currency needs an exchange rate we do not store. So read this as directional — US home insurance costs several times more, driven by genuine catastrophe exposure (hurricanes, wildfires, tornadoes) — not a precise multiple.
“Fixing your rate” means something different in each country
The US is dominated by the 30-year fixed; Canada uses short ~5-year terms with mandatory renewal and a stress test (the higher of 5.25% or your rate + 2%); the UK uses 2–5-year fixesthat revert to the lender's standard variable rate. Caveat: this is exactly why comparing headline mortgage ratesacross the three is misleading — the same “fixed rate” is locked for very different lengths of time.
We deliberately do not headline a cross-country affordability or “median home” comparison: matched median-price and median-income data isn't available for Canada and the UK in our datasets, so any such number could not be verified against our sources.
Source: Insurance.com (US) · IBC (CA) · ABI (UK) · Verified 2026-07-01
Quick cite · United States
29 of 51
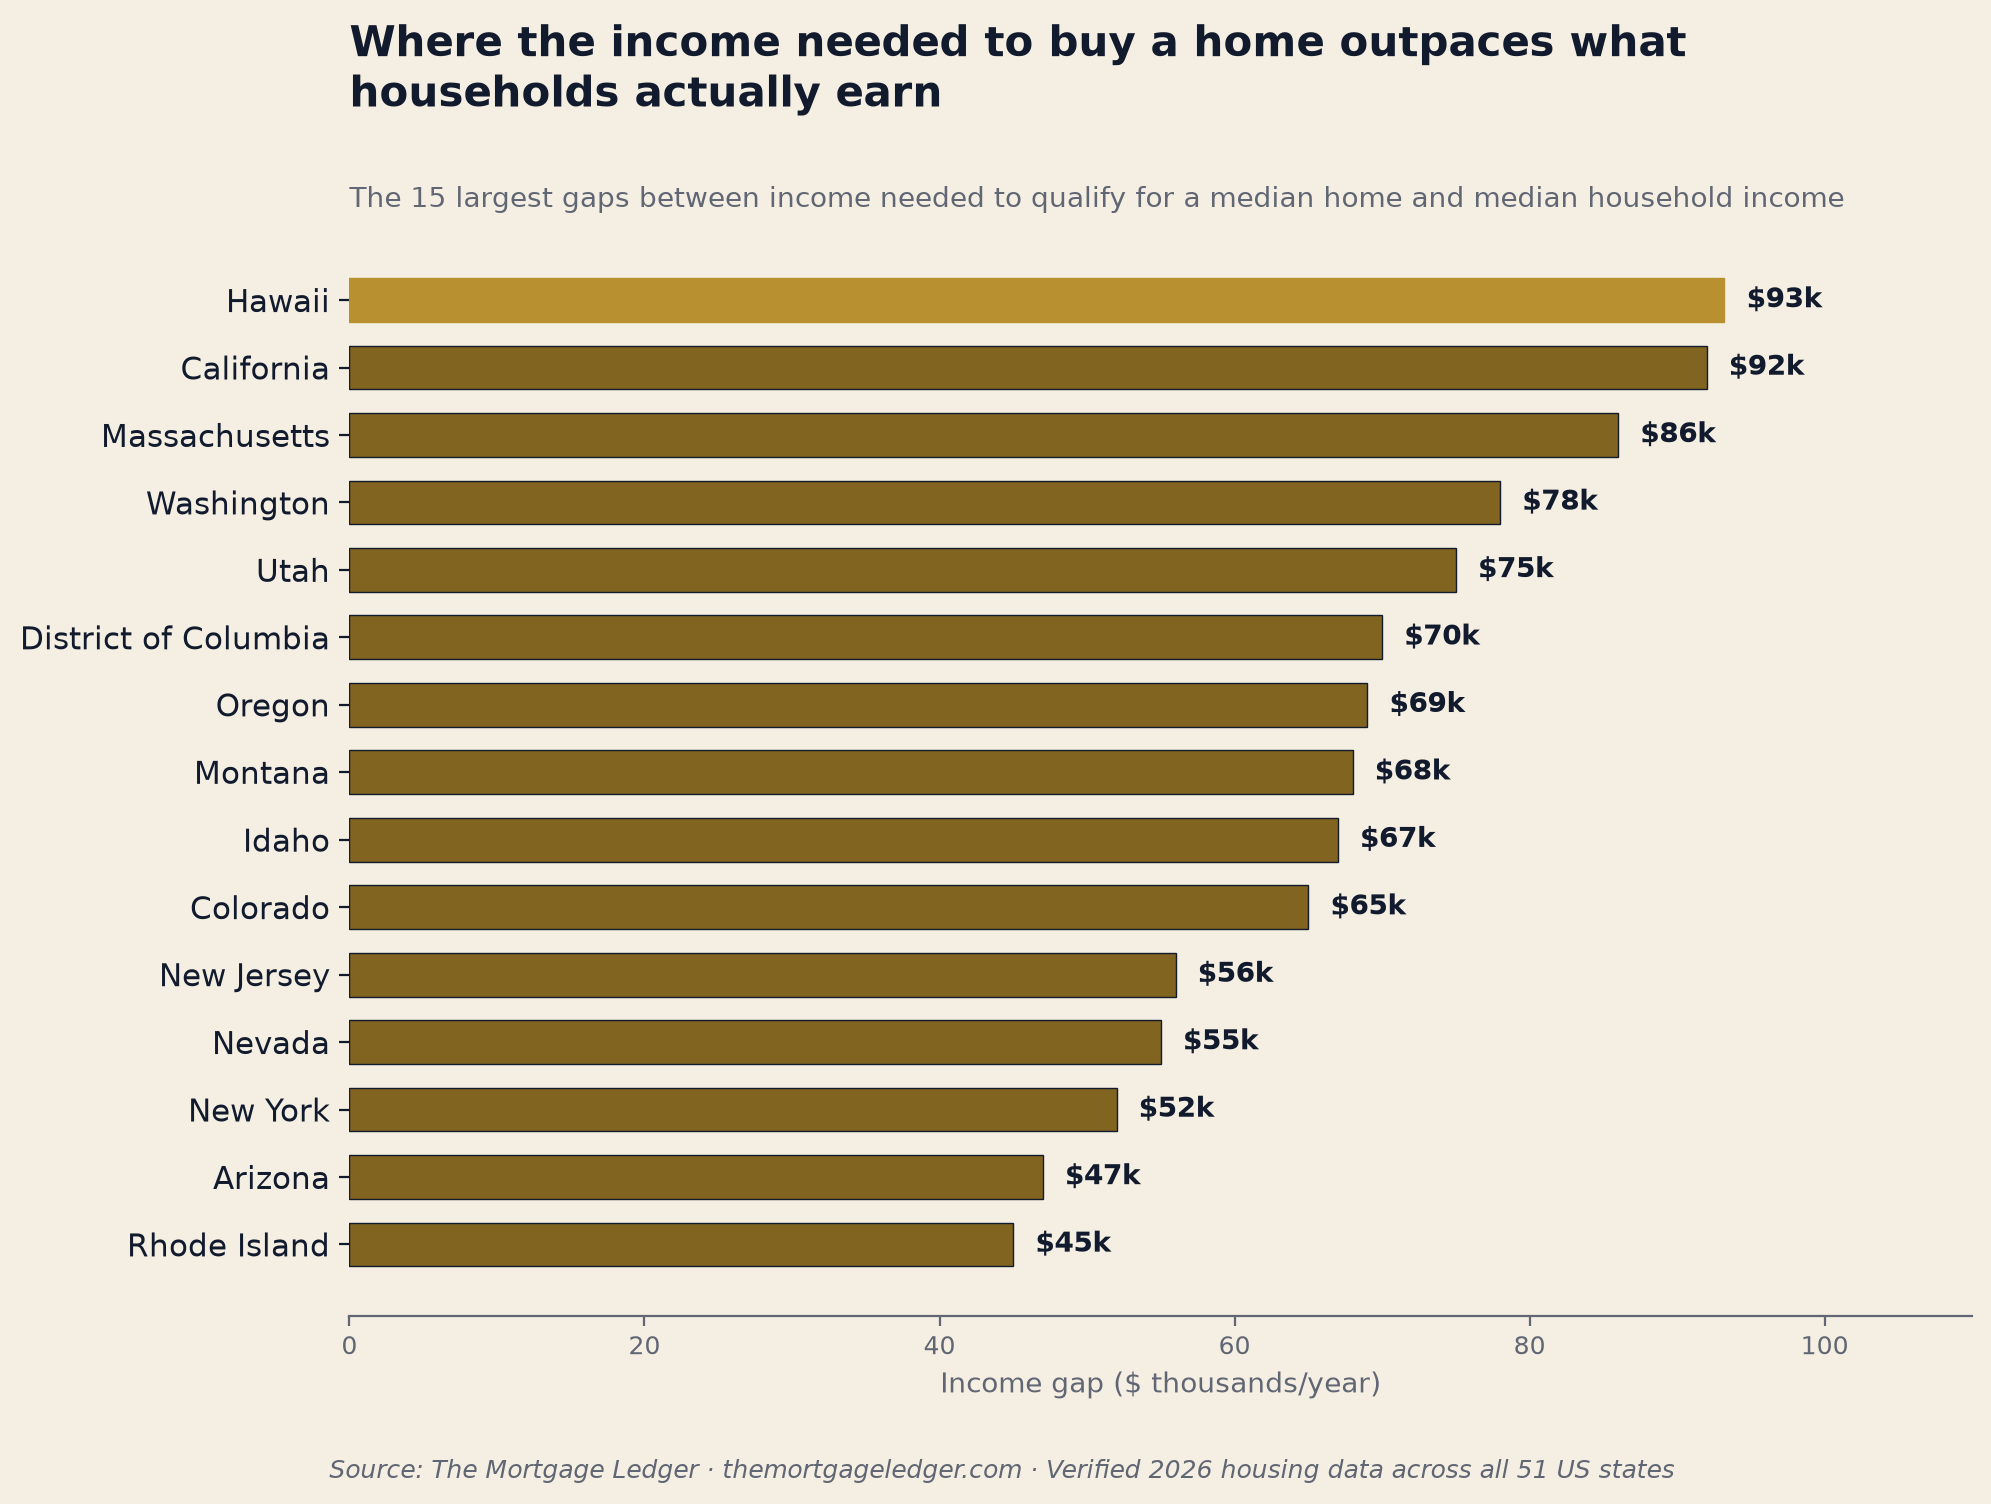
In 29 of 51 US states, a single median income is no longer enough to buy a median-priced home.
Embed code
<img src="https://themortgageledger.com/press/income-gap-by-state.png"
     alt="The largest gaps between the income needed to buy a median home and median household income, by US state"
     width="1000" />
<p>Source: <a href="https://themortgageledger.com/press#us">The Mortgage Ledger</a></p>
Deep dive · United States
We compared the income a lender typically wants to see (the standard 28% debt-to-income guideline) against actual median household income, in every US state. In 29 states — including California, New York, Washington, and Colorado — the gap is large enough that a single earner at the median household income can no longer comfortably qualify for a median-priced home alone.
Nationally, the median home now requires roughly $112,900/year in income at standard lending guidelines, while the median household earns roughly $83,700 — a $29,200 gap.
| State | Income needed | Median income | Gap | Two incomes? |
|---|---|---|---|---|
| Hawaii | $191,449 | $98,240 | +$93,209 | Yes |
| California | $192,600 | $100,600 | +$92,000 | Yes |
| Massachusetts | $184,000 | $98,000 | +$86,000 | Yes |
| Washington | $171,000 | $93,000 | +$78,000 | Yes |
| Utah | $157,000 | $82,000 | +$75,000 | Yes |
| District of Columbia | $178,000 | $108,000 | +$70,000 | Yes |
| Oregon | $144,000 | $75,000 | +$69,000 | Yes |
| Montana | $130,000 | $62,000 | +$68,000 | Yes |
| Idaho | $134,000 | $67,000 | +$67,000 | Yes |
| Colorado | $154,000 | $89,000 | +$65,000 | Yes |
| New Jersey | $153,000 | $97,000 | +$56,000 | Yes |
| Nevada | $123,000 | $68,000 | +$55,000 | Yes |
| New York | $130,000 | $78,000 | +$52,000 | Yes |
| Arizona | $119,000 | $72,000 | +$47,000 | Yes |
| Rhode Island | $124,000 | $79,000 | +$45,000 | Yes |
| Florida | $113,000 | $69,000 | +$44,000 | Yes |
| New Hampshire | $132,000 | $90,000 | +$42,000 | Yes |
| Maine | $102,000 | $67,000 | +$35,000 | Yes |
| Vermont | $107,000 | $74,000 | +$33,000 | Yes |
| Wyoming | $105,000 | $72,000 | +$33,000 | Yes |
| Tennessee | $95,000 | $63,000 | +$32,000 | Yes |
| Virginia | $117,000 | $87,000 | +$30,000 | Yes |
| New Mexico | $81,000 | $55,000 | +$26,000 | Yes |
| North Carolina | $92,000 | $67,000 | +$25,000 | Yes |
| South Carolina | $85,000 | $60,000 | +$25,000 | Yes |
| Delaware | $103,000 | $79,000 | +$24,000 | Yes |
| Georgia | $93,000 | $71,000 | +$22,000 | Yes |
| South Dakota | $85,000 | $63,000 | +$22,000 | Yes |
| Connecticut | $109,000 | $90,000 | +$19,000 | No |
| Texas | $87,000 | $68,000 | +$19,000 | Yes |
| Maryland | $114,000 | $98,000 | +$16,000 | No |
| Alaska | $95,000 | $82,000 | +$13,000 | No |
| Minnesota | $93,000 | $80,000 | +$13,000 | No |
| Wisconsin | $80,000 | $70,000 | +$10,000 | No |
| Pennsylvania | $77,000 | $69,000 | +$8,000 | No |
| Alabama | $63,000 | $56,000 | +$7,000 | No |
| Indiana | $70,000 | $65,000 | +$5,000 | No |
| Michigan | $70,000 | $65,000 | +$5,000 | No |
| Illinois | $80,000 | $76,000 | +$4,000 | No |
| Kentucky | $60,000 | $57,000 | +$3,000 | No |
| Louisiana | $56,000 | $53,000 | +$3,000 | No |
| Nebraska | $73,000 | $70,000 | +$3,000 | No |
| Ohio | $65,000 | $62,000 | +$3,000 | No |
| Mississippi | $50,000 | $48,000 | +$2,000 | No |
| Missouri | $65,000 | $63,000 | +$2,000 | No |
| North Dakota | $72,000 | $72,000 | $0 | No |
| West Virginia | $50,000 | $50,000 | $0 | No |
| Oklahoma | $56,000 | $57,000 | -$1,000 | No |
| Kansas | $63,000 | $65,000 | -$2,000 | No |
| Arkansas | $49,000 | $52,000 | -$3,000 | No |
| Iowa | $58,000 | $68,000 | -$10,000 | No |
Source: Zillow ZHVI · U.S. Census ACS · Splitero · Verified 2026-06-30
The median homeowner has roughly 40× the net worth of the median renter
Federal Reserve data puts the median homeowner's net worth near $396,200 versus about $10,400 for the median renter. Caveat: the gap reflects both the genuine wealth-building effect of owning (forced savings, leverage) and the fact that wealthier households are likelier to own in the first place — it is not purely causal.
The mechanisms and caveats in full: Why real estate builds wealth — and when it doesn't.
Source: Federal Reserve Survey of Consumer Finances / Aspen Institute · Verified 2026-06-30
Methodology & sources: how every figure is derived and dated.
For journalists: need a custom cut for your angle? Reach us at themortgageledger@gmail.com.
Quick cite · Canada
2×
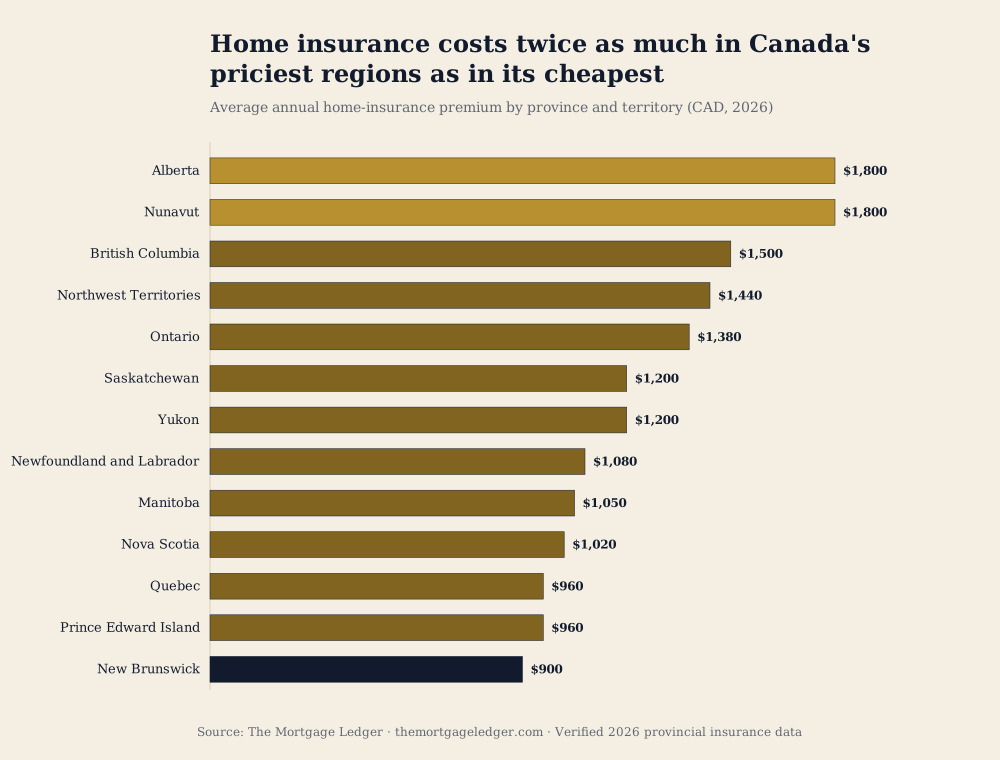
Insuring the same home costs about twice as much in Canada's priciest regions — around $1,800 a year in Alberta and Nunavut — as in its cheapest, New Brunswick, at about $900.
Embed code
<img src="https://themortgageledger.com/press/ca-insurance-by-province.svg"
     alt="Average annual home-insurance premium by Canadian province and territory (CAD, 2026)"
     width="1000" />
<p>Source: <a href="https://themortgageledger.com/press#ca">The Mortgage Ledger</a></p>
Deep dive · Canada
The premium is the average annual cost to insure a typical home in each province or territory. The spread is wide: Alberta and Nunavut sit at about $1,800, while New Brunswick is roughly $900 — a twice. These are benchmark averages for comparison between regions; an actual quote varies by home, location within the province, claims history, and insurer.
| Province / territory | Avg annual premium | Enforcement |
|---|---|---|
| Alberta | $1,800 | Judicial sale · 6 mo |
| Nunavut | $1,800 | Judicial sale · 10 mo |
| British Columbia | $1,500 | Judicial sale · 8 mo |
| Northwest Territories | $1,440 | Judicial sale · 8 mo |
| Ontario | $1,380 | Power of sale · 4 mo |
| Saskatchewan | $1,200 | Judicial sale · 6 mo |
| Yukon | $1,200 | Judicial sale · 6 mo |
| Newfoundland and Labrador | $1,080 | Judicial sale · 8 mo |
| Manitoba | $1,050 | Judicial sale · 6 mo |
| Nova Scotia | $1,020 | Power of sale · 4 mo |
| Quebec | $960 | Judicial sale · 12 mo |
| Prince Edward Island | $960 | Power of sale · 4 mo |
| New Brunswick | $900 | Power of sale · 4 mo |
The land-transfer-tax picture is messier than it looks
3 provinces charge no land transfer tax at all — Alberta, Saskatchewan, Newfoundland and Labrador— so a buyer there avoids a closing cost that can run into five figures elsewhere. But “no transfer tax” is a headline trap worth spelling out: the three territories (NWT, Nunavut, Yukon) still levy land-registrationfees; Nova Scotia's deed transfer tax is set by each municipality, not the province, so the rate varies by town; and where the tax does apply, first-time-buyer rebates offset much of it (Ontario up to $4,000, BC a full exemption up to $500,000, PEI a full exemption with no price cap). We kept this out of the flagship for exactly that reason — it's real, but it needs the caveats, so it lives here as context rather than as a number.
Canada has no US-style “foreclosure”
Lenders enforce a mortgage two different ways: 4 provinces use power of sale (Ontario, Nova Scotia, New Brunswick, Prince Edward Island) and 9 use judicial sale — court-supervised, and slower. Quebec takes the longest at roughly 12 months, consistent with its distinct civil-law system. Timelines are typical approximations, not guarantees.
Source: Federal/provincial sources · Ratehub · WOWA · Verified 2026-06-30
Methodology & sources: how every figure is derived and dated.
For journalists: need a custom cut for your angle? Reach us at themortgageledger@gmail.com.
Quick cite · United Kingdom
£0–£4,500
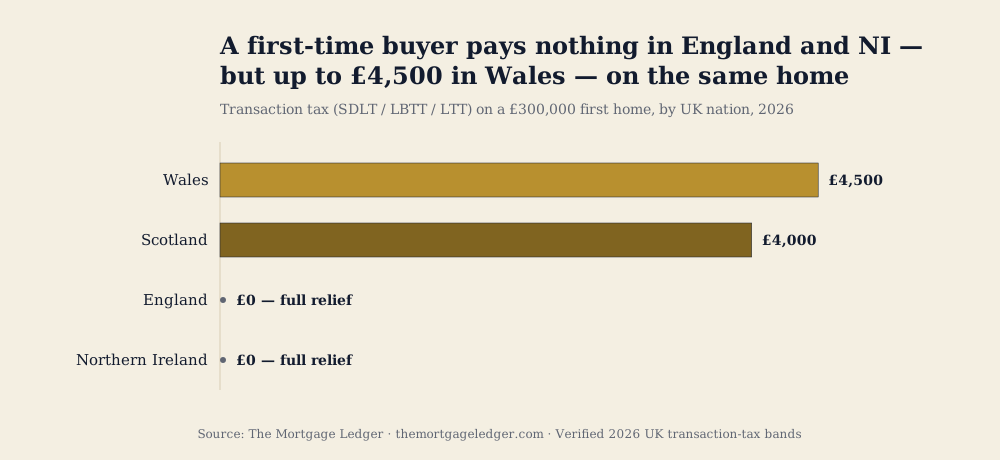
A first-time buyer purchasing the same £300,000 home pays nothing in England and Northern Ireland — but £4,000 in Scotland, and £4,500 in Wales.
Embed code
<img src="https://themortgageledger.com/press/uk-first-time-buyer-tax.svg"
     alt="First-time-buyer transaction tax on a £300,000 home by UK nation (2026)"
     width="1000" />
<p>Source: <a href="https://themortgageledger.com/press#uk">The Mortgage Ledger</a></p>
Deep dive · United Kingdom
On the same £300,000 first home, the purchase tax ranges from £0 to £4,500 depending on the nation. £300,000is a deliberate benchmark — it's the UK average price and exactly England's first-time-buyer nil-rate threshold, which is why the gap is starkest here.
| Nation | Purchase tax | FTB tax on £300k | Ongoing tax | Avg insurance |
|---|---|---|---|---|
| England | SDLT | £0 | Council Tax | £200/yr |
| Scotland | LBTT | £4,000 | Council Tax | £180/yr |
| Wales | LTT | £4,500 | Council Tax | £190/yr |
| Northern Ireland | SDLT | £0 | Domestic Rates | £460/yr |
On the purchase tax, Northern Ireland isn't its own regime
England and Northern Ireland use the same tax — Stamp Duty Land Tax, identical bands — so they always match (both £0 for a first-time buyer at £300,000). Only Scotland (LBTT) and Wales (LTT) run genuinely separate systems. Wales is the one nation with no first-time-buyer reliefat all, which is why it tops the chart. And the ranking isn't fixed: on a £400,000 first home the order flips — Scotland's LBTT reaches £12,750 versus £5,000in England and NI — because LBTT's upper bands are steeper.
On the ongoing tax, Northern Ireland genuinely differs
England, Scotland, and Wales all bill ongoing property tax as Council Tax (valuation bands). Northern Ireland is the exception: it uses Domestic Rates, charged on a property's capital valuerather than bands — a different system, so an NI bill isn't a like-for-like Council Tax band. This is exactly the distinction that's easy to flatten by mistake; we keep it separate.
Northern Ireland also has the UK's priciest home insurance
At about £460/year, NI insurance runs roughly 2.4× the £190 average across England, Scotland, and Wales — driven by flood risk and fewer competing insurers. Premiums are benchmark averages; an actual quote varies by property and postcode.
Source: Compare the Market · Go.Compare · ABI · Verified 2026-06-30
Methodology & sources: how every figure is derived and dated.
For journalists: need a custom cut for your angle? Reach us at themortgageledger@gmail.com.
Quick lookup
Look up a region
Pick a US state, Canadian province/territory, or UK nation for a citable, copy-ready fact.
Get the data
Download the underlying data
The exact figures behind every stat and chart on this page — generated from our source data at build time, so a download can never drift from what you're citing. CSV opens in Excel or Google Sheets; JSON is there for developers.
License — free to use, with credit
Free to use, share, and adapt for any purpose, including commercially, with attribution to The Mortgage Ledger and a link back. Released under CC BY 4.0. Please attribute The Mortgage Ledger with a link to this page.
United States
51 rows · verified 2026-06-3051 states — affordability (median price, income to qualify, gap), home insurance, property tax.
Canada
13 rows · verified 2026-06-3013 provinces & territories — land transfer tax, first-time-buyer rebates, insurance, property tax, enforcement.
United Kingdom
4 rows · verified 2026-06-304 nations — transaction tax (SDLT/LBTT/LTT), first-time-buyer tax, relief, insurance, ongoing tax.
Embed the charts
Put a chart in your article
Copy the code below into your page. Each chart is responsive (it fills its container), stays in sync with our live data, and includes a source credit that links back here — no attribution to type. Free to use under the same CC BY 4.0 license.
US — income gap by state
Embeds the same chart as the US view; links to /press#us.
Embed code
<iframe src="https://themortgageledger.com/press/embed/us" title="US — income gap by state — The Mortgage Ledger" loading="lazy" style="width:100%;max-width:680px;aspect-ratio:1991/1504;border:0"></iframe>
<p style="margin:6px 0;font:13px/1.4 system-ui,Arial,sans-serif;color:#555">Chart: <a href="https://themortgageledger.com/press#us">The Mortgage Ledger</a></p>
Canada — home insurance by province
Embeds the same chart as the CA view; links to /press#ca.
Embed code
<iframe src="https://themortgageledger.com/press/embed/ca" title="Canada — home insurance by province — The Mortgage Ledger" loading="lazy" style="width:100%;max-width:680px;aspect-ratio:1000/760;border:0"></iframe>
<p style="margin:6px 0;font:13px/1.4 system-ui,Arial,sans-serif;color:#555">Chart: <a href="https://themortgageledger.com/press#ca">The Mortgage Ledger</a></p>
UK — first-time-buyer tax by nation
Embeds the same chart as the UK view; links to /press#uk.
Embed code
<iframe src="https://themortgageledger.com/press/embed/uk" title="UK — first-time-buyer tax by nation — The Mortgage Ledger" loading="lazy" style="width:100%;max-width:680px;aspect-ratio:1000/460;border:0"></iframe>
<p style="margin:6px 0;font:13px/1.4 system-ui,Arial,sans-serif;color:#555">Chart: <a href="https://themortgageledger.com/press#uk">The Mortgage Ledger</a></p>
Cross-country — flood coverage models
Embeds the same chart as the cross-country flagship; links to /press#cross-country.
Embed code
<iframe src="https://themortgageledger.com/press/embed/cross" title="Cross-country — flood coverage models — The Mortgage Ledger" loading="lazy" style="width:100%;max-width:680px;aspect-ratio:1000/440;border:0"></iframe>
<p style="margin:6px 0;font:13px/1.4 system-ui,Arial,sans-serif;color:#555">Chart: <a href="https://themortgageledger.com/press#cross-country">The Mortgage Ledger</a></p>
All figures are educational estimates from public data — see each figure's source. Free to cite with credit to The Mortgage Ledger.